If you haven’t heard, we just tore down the pay-wall on Business Breakdowns to make it a free newsletter. As part of the re-launch, we’re rolling out our formerly paid articles over the next several months so sign-up if you’d like to get hit with an avalanche of free business analysis!
Two fun facts to start this one:
1) Netflix has spent over $100 billion on content over the past 9 years
2) Over the past 5 years, Netflix has added almost 5x the number of international subscribers relative to the US and Canada (UCAN).
International additions: 99 million
UCAN additions: 22 million
The elephant in the room for Netflix is competition. Obviously, streaming is crowded. Netflix believes there is still a lot of room for growth but attention is a scarce resource. One thing Netflix likes to point out is that its $30 billion in revenue is tiny compared to the $300 billion global opportunity, $180 billion in TV advertising and $130 billion in consumer gaming.
Netflix does have a sizable content lead though.
This next brief section was written over 3 years ago when there were serious fears about Disney+ — I wanted to leave it in just as I think it’s an example of how deeply understanding how a business works can allow you to see through dark clouds.
A lot of investor attention is on Disney+ right now, but I’m skeptical that Netflix will face a ton of pressure. Sure, there may be a little bit of increased churn, but the endgame (no Avenger pun intended) for Disney is different than Netflix.
Disney+ is another direct-connection hub for Disney fans. At $7-ish/month, clearly Disney is not maximizing revenue. But imagine all the data it will be able to collect. It will have deep insight into how fans interact with its content. Oh, your daughter watched Frozen 3 times in the past three months, here’s a conveniently placed ad for our new Frozen-themed Alaskan cruise. That sort of thing.
In this light, Disney+ is a way for Disney to expand its average revenue per Disney fan. Fundamentally, this is different than Netflix’s ideal to be the leader in streaming.
Ok, we needed to cover that. Onto the business model!
Netflix has three revenue segments:
1. UCAN streaming
2. International streaming
3. Domestic DVD
In 2018, UCAN streaming made up about 75% of the contribution profit even though it had 22 million fewer subscribers. That gap now is much more drastic. The company has 156 million international subscribers vs. 74 million UCAN subs.
Over the last 5 years, Netflix has added 22 million subs in the US and Canada versus 99 million in international territories.
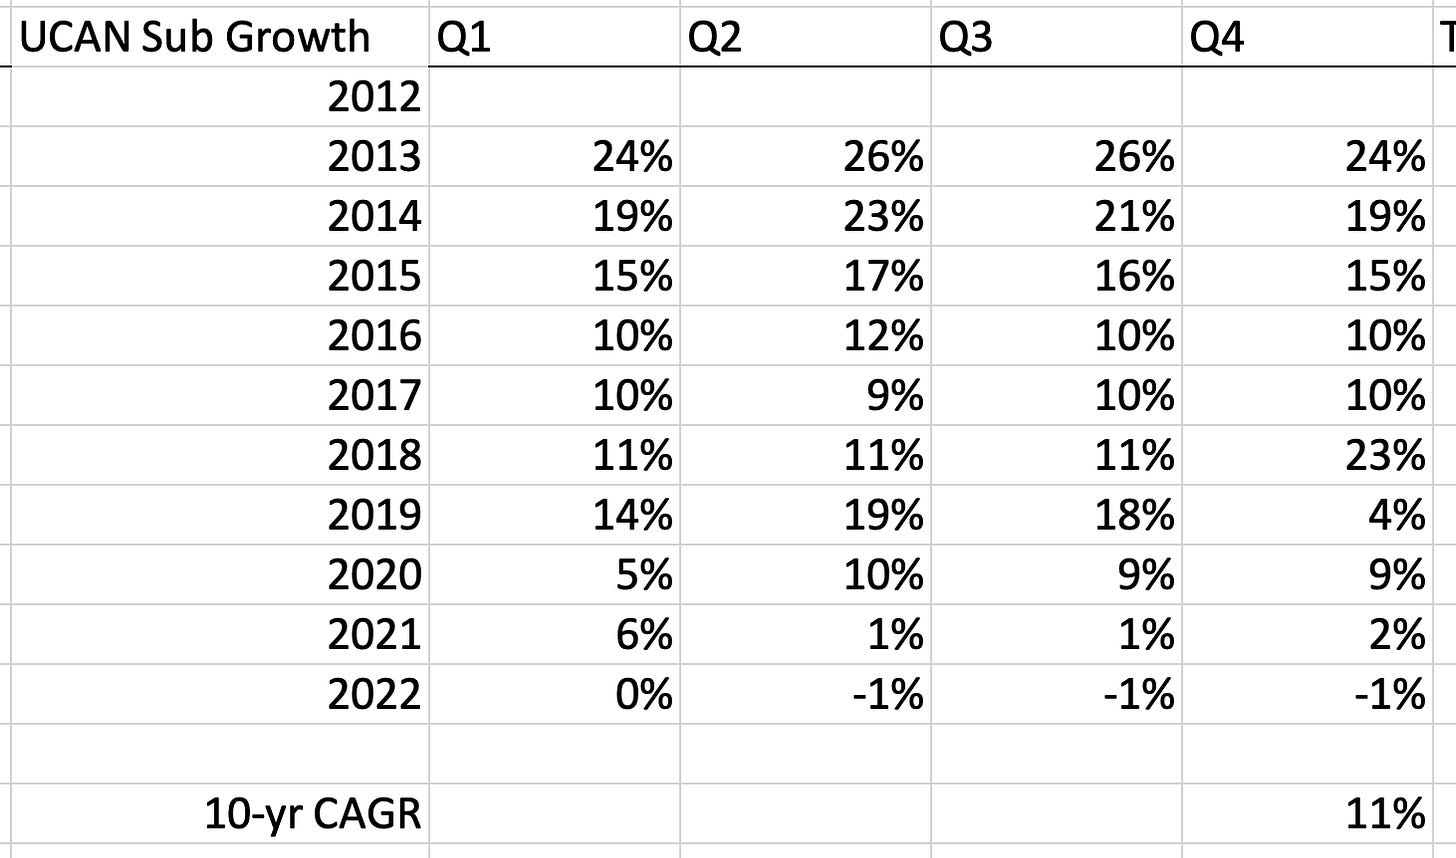
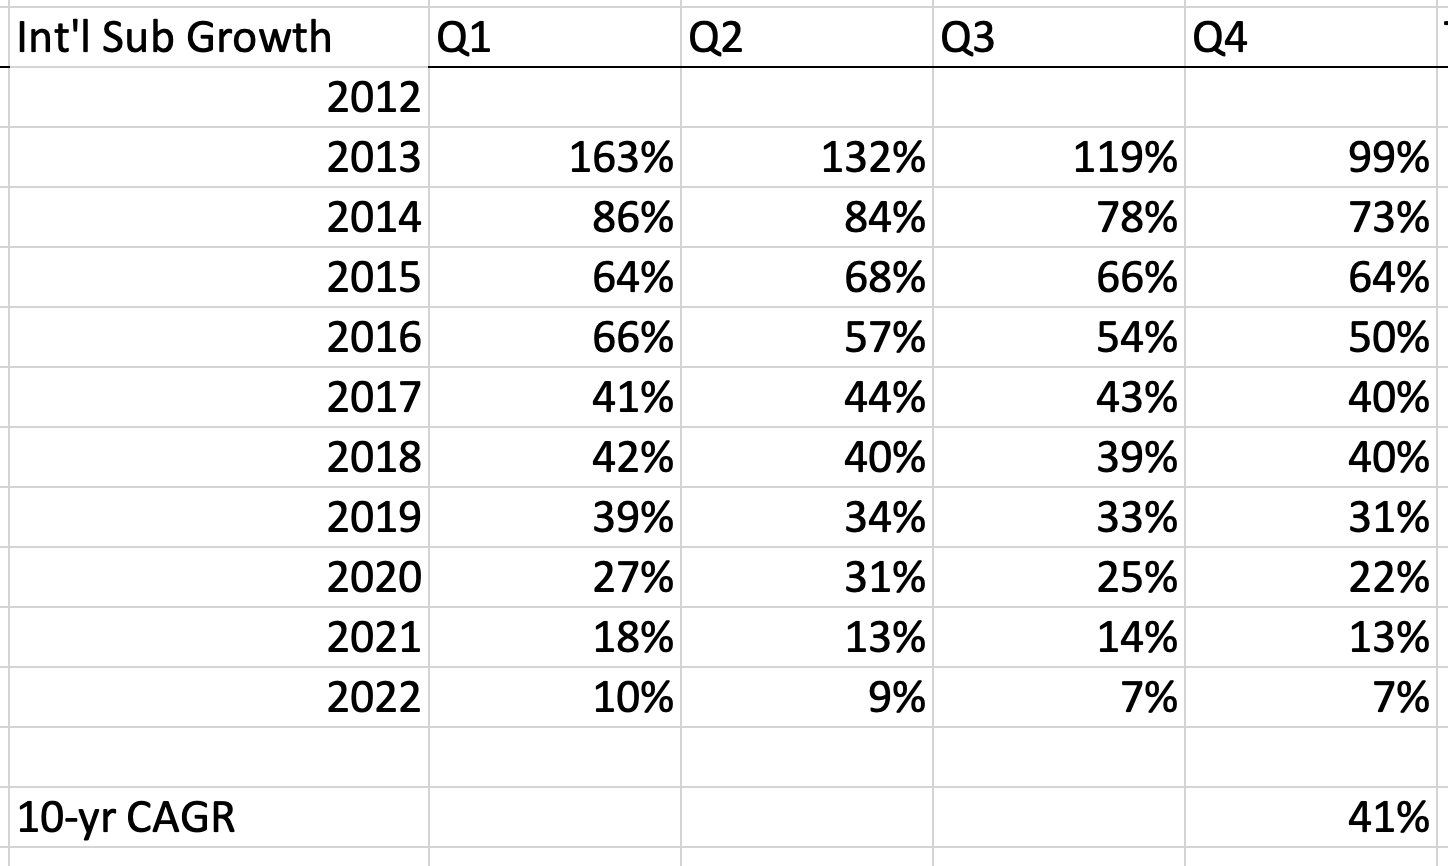
Below, you’ll be able to see the growth rates for both over the last decade:
At the end of 2012, Netflix had 25 million domestic subs and now it has 74 million. In the same period, international subs went from just 5 million to 156 million. So it’s clear that Netflix’s growth has mainly come from international customers.
Here are the actual revenue growth numbers:
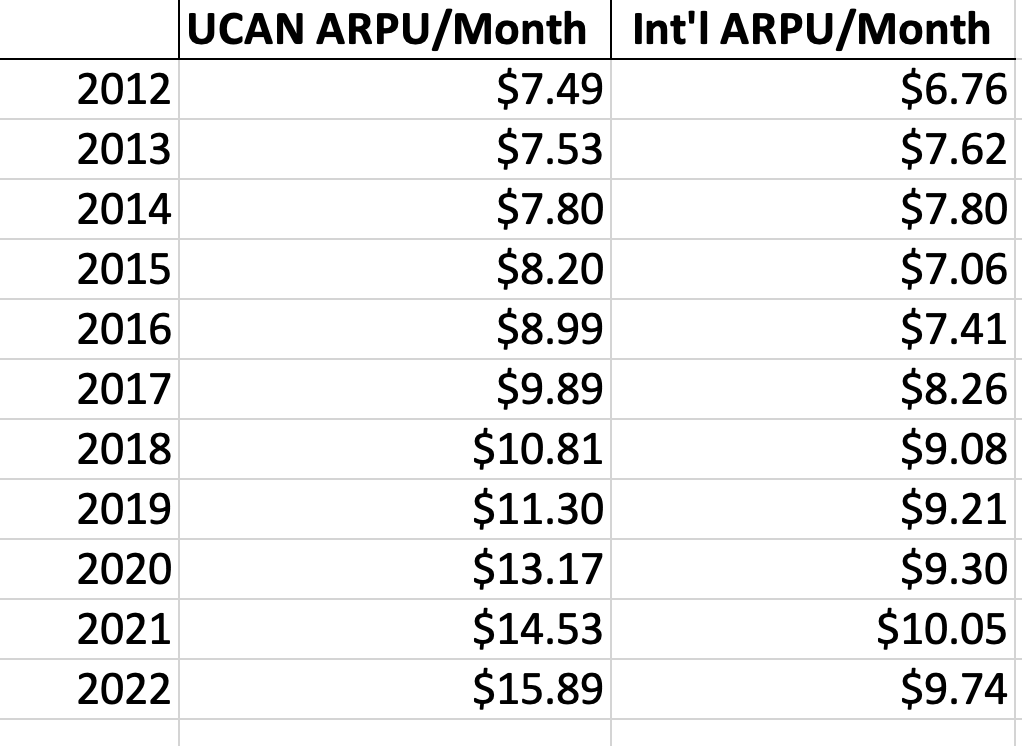
Note that though UCAN subs only grew at an 11% CAGR over the past decade, revenue grew at nearly double the rate.
This is, of course, due to price increases. After all, revenue is just price * quantity.
The company, naturally, has been much more aggressive with price increases in higher-income countries.
This is also why the majority of overall contribution profit comes from the US, even with vastly smaller absolute number of subscribers.
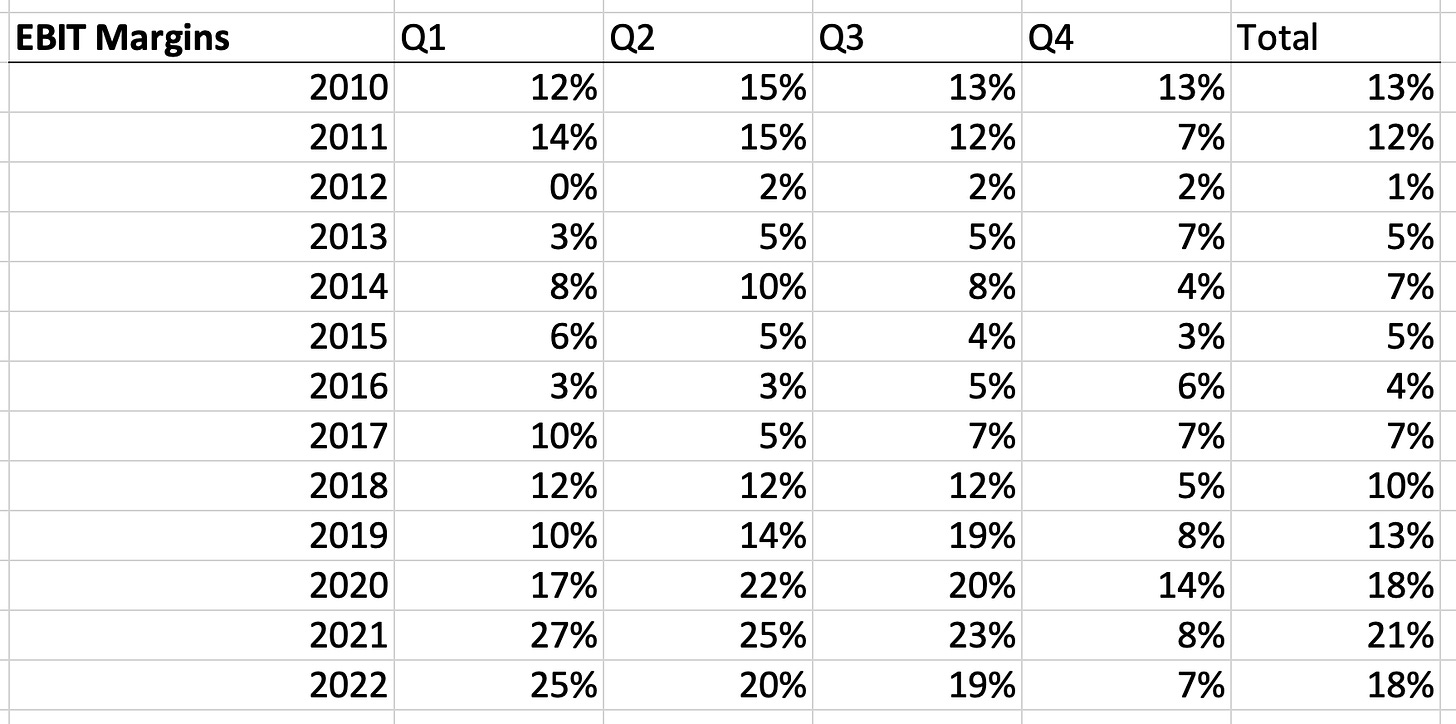
Further, here's a look at the company's EBIT margins. Bonus points for guessing when they starting investing heavily in streaming. 😉
The improvement in international contribution margins is a huge piece of this.
Netflix's "moat" is having the lowest cost per subscriber after investing aggressively for two decades. It has 230 million subscribers total so it can maintain a lower cost structure on a per sub basis. This is why it will be difficult for any streaming service to knock the company off its perch as the leader. It has the biggest subscriber base so it can more easily spread its content costs. This results in a lower content spend per subscriber, which means it can spend more to acquire subscribers and the virtuous flywheel continues.
Below is a very strange and tiny chart but it’s basically Netflix’s moat in one picture. It shows the number of subscribers divided by the content spend in that year. So in 2019, Netflix spent $93 per subscriber on new content and blended revenue per sub was about $121/year. The highlighted number is the ARPU - the spend/sub. So in 2018, that delta was nearly $28 and now, 4 years late, it has increased to over $63. These are very high level but it shows that Netflix can spread out its content costs across and increasingly large base which gives it scale economies.
But of course, we need to finish with discussing content amortization. This is probably still the most misunderstood thing about the company. Basically, since Netflix has focused more on making their own content, it has to spend a disproportionate amount on upfront production costs but most content is 90% amortized after 4 years.
[Before diving in, if you don’t understand amortization fully, it won’t be as helpful to you. So if you need it, here’s a primer on the concept of amortization. It’s what depreciation is to physical assets but for intangible assets. A good example of depreciation is when you drive your car off a lot, it depreciates roughly 20%, right? It goes down in value. Well, in accounting, depreciation is used for capital expenditures to adjust for lumpy purchases. So if you bought a factory for $1 million and it was depreciated over 20 years, you would have to account for $50,000 (1 mil / 20) of depreciation on your income statement every year, though your cash flow statement would show all of the $1 million purchase when you initially paid for the factory.]
Back to your regularly scheduled programming…
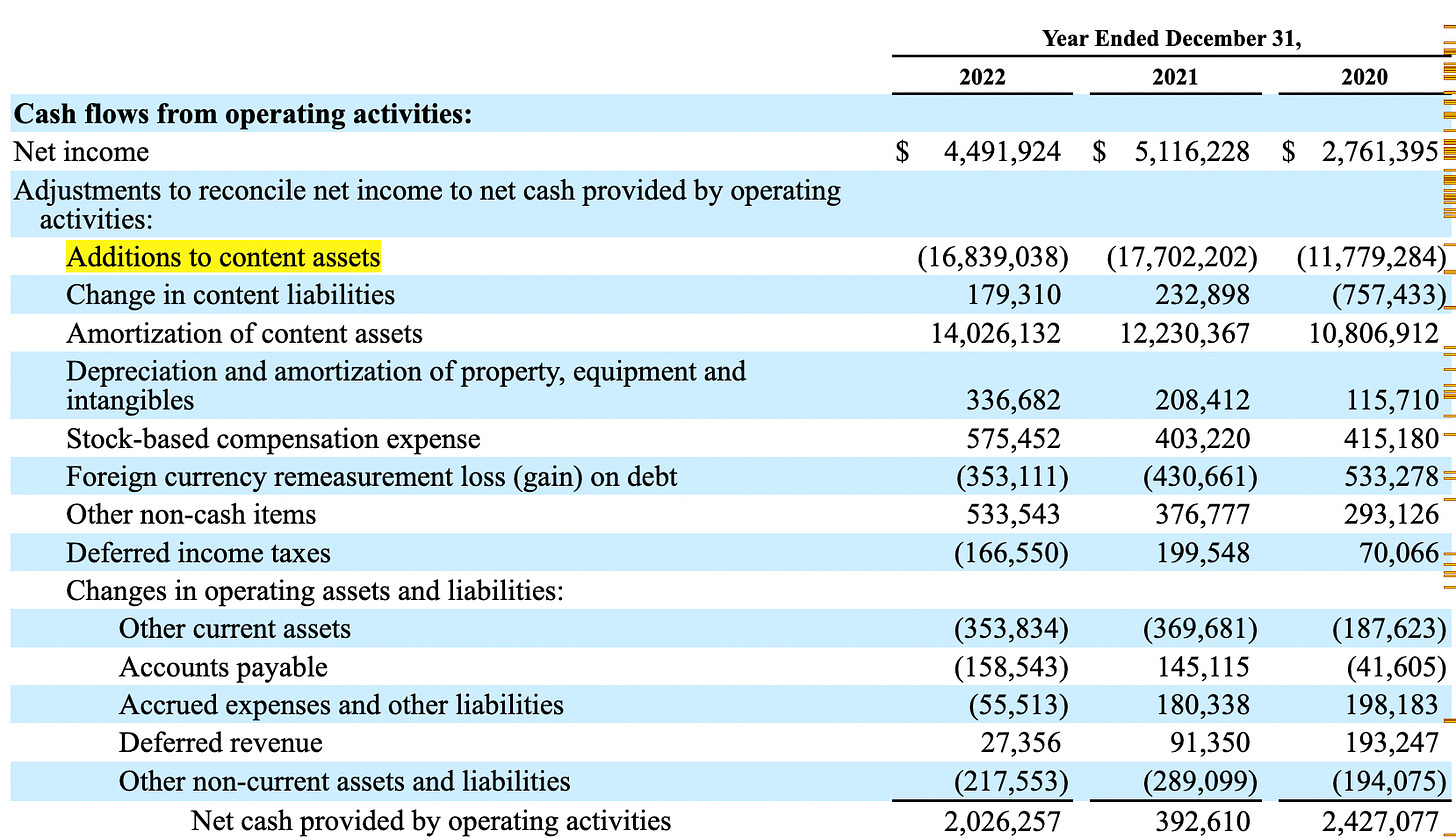
As a cheat code, you can pretty much tell how much Netflix spent on content by taking a quick look at the cash flow statement and locating “additions to content assets.” Those have barely been amortized yet so it’s a good number to look at.
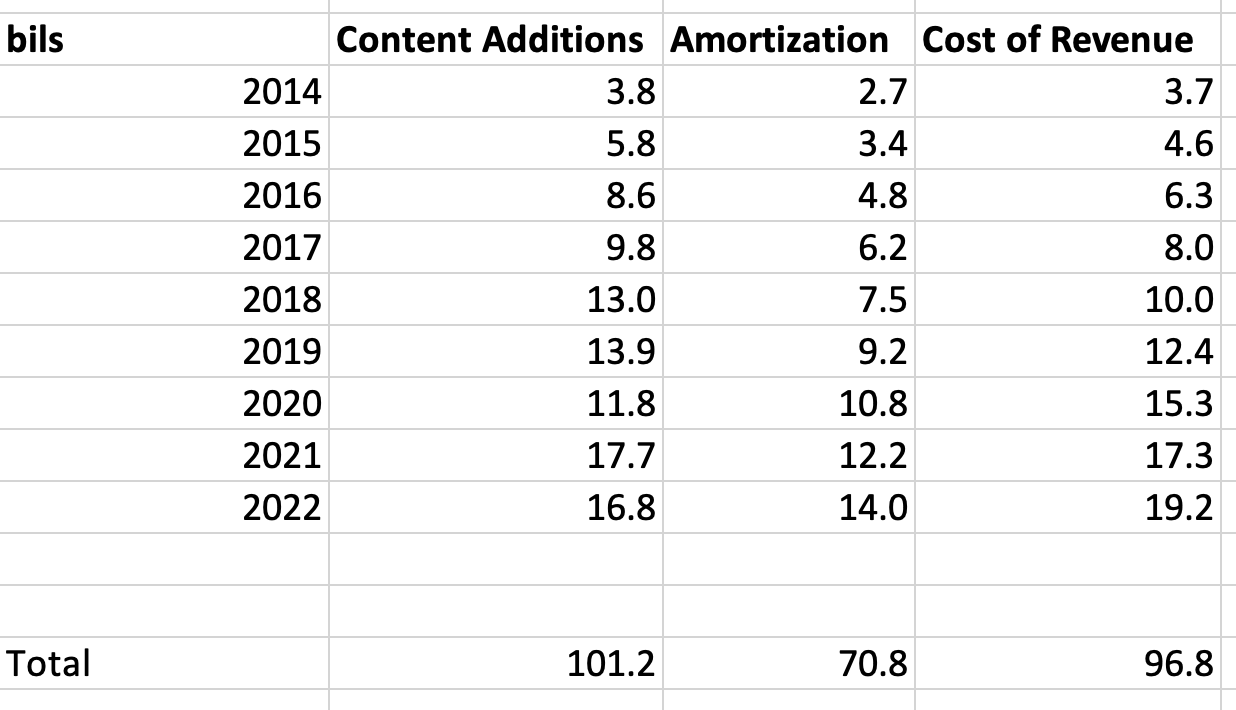
Below I’ve added up the last nine years of content additions, which map very tightly with cost of revenue, and compared it to total amortization of content assets. You can see there is basically a $31 billion accumulated difference. This is why Netflix doesn’t throw off much cash flow — content additions are higher than the amortization.
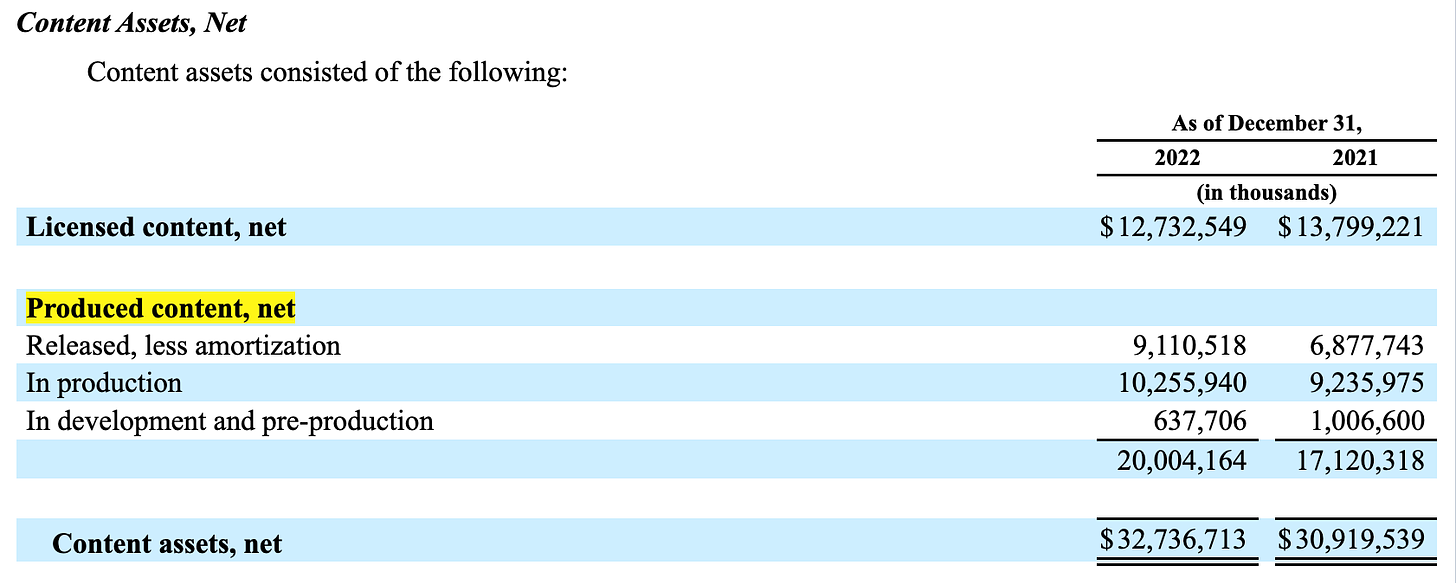
Moreover, that $31 billion delta is pretty well accounted for by the net content assets on the balance sheet. It’s the content assets that have yet to be amortized. So even though Netflix has spent over $100 billion on content over the past 10 years, the balance sheet and GAAP say that is only worth about 30% of its original value. Poof, that $70 billion in value has disappeared because the accounting rules says that 90% of shows are effectively worthless to the company after four years. I really love how, at the end of the day, accounting is fairly subjective. Jerry Seinfeld and the creators of The Office would certainly beg to differ. On the other hand, some shows are virtually worthless after one year.
But this dynamic is really at the core of understanding Netflix. Since it has the biggest subscriber base, it can essentially have the lowest content costs per subscriber. And though all of the value of those investments gets written down to zero over 10 years and, on an accelerated basis, 90% gets amortized after four years, there are some shows that provide much more value than the accounting gives them credit for. Some shows will actually lose value even more quickly but all the while, Netflix is building up its catalog to be stronger and stronger and not have pay incremental licensing fees in the future.
While the math is sort of tricky — let’s end by trying to granularly figure out how much Netflix original content affects the cash flow statement.
Let’s start with gathering the data on the breakdown between produced and licensed content.
Below, the data is balance sheet data — this is the split between net production content assets and licensed content assets. You can see that produced content is up from 20% to 61% of total content assets over the last six years. No surprise there, we know Netflix is making more of its own content.
In this chart, we have amortization data between produced content and licensed content. We can see that it directionally maps to the greater proportion of produced content. However, there is a lag effect since amortization takes some time. Remember how we said that 90% of content is amortized over four years. Well, a good chunk, is amortized right away because a show loses a lot of its value in the first year or two once everyone watches it. But it still doesn’t fully amortize which is why the lag effect exists.
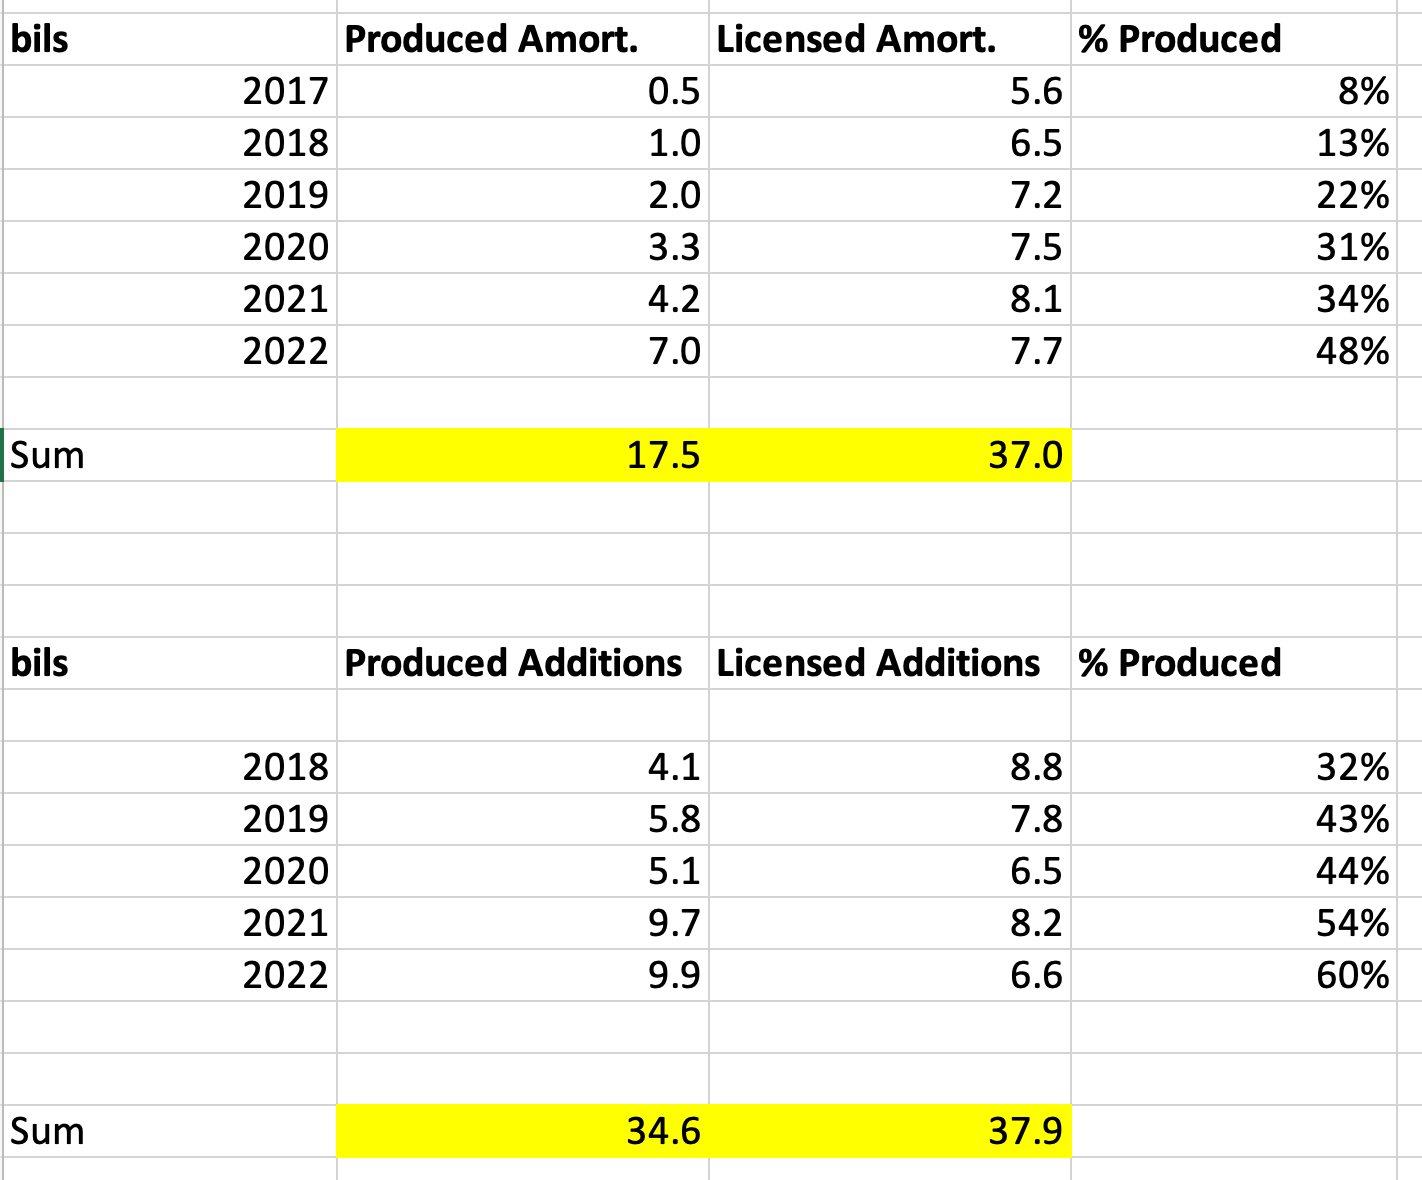
Ok, we’re slowly getting there! Now, with these last two charts, we can actually triangulate and figure out the proportion of added produced content vs. added licensed content. We already have the total content additions data from the cash flow statement, but now with this more detailed data, we can figure out the exact additions for produced vs. licensed content.
All we have to do is add the more recent content asset number to the amortization and then subtract the last year of content assets. For example, 2021 had $17.1 billion in net produced content assets, 2022 had $20 billion and $7 billion was amortized in 2022. So (20 + 7) - 17.1 = 9.9. Sweet!
Below is a chart with our new data set.
So in the last three years, Netflix has actually spent more money ($24.7 billion) on producing their own content than licensing other content ($21.3 billion). There it is, the real numbers!
Going back to that lag effect, though Netflix spent $9.7 billion in produced content in 2021, only $7 billion was amortized. That is a nearly $3 billion hit to free cash flow!!
If we do the same calculation with licensed content, Netflix spent $8.2 billion in 2021 on licensed content but amortized $7.7 billion. That’s only a $500 million hit to free cash flow.
So here’s where the rubber hits the road — this is the crux of understanding Netflix’s free cash flow.
Even though Netflix spent 18% more on produced content vs. licensed content in 2021, the 2022 free cash flow negative impact was 6x worse!
This is because, once again, Netflix is producing more and more content and you have to account for all of the spend upfront, just like capex but then you can add it back through amortization. You can see very clearly below free cash flow impact over the last five years (2018-2022). Netflix cumulatively spent almost $35 billion on content production but only $17.5 billion was amortized. This directly effects free cash flow.
So, theoretically — though this isn’t possible because tons of shows are already being produced — if Netflix didn’t produce any of its own shows in 2022, free cash flow would’ve been a whole lot higher. Herein lies the key to understanding Netflix — higher costs upfront but lower costs over time since they don’t have to continue paying licensing fees.









While Netflix scale and operating efficiency is laudable, esp. now compared to other streamers. They are nearing the top of their pricing power. I don't think anyone would be willing to pay over $20 for the service except for the top percentile of the wealthiest households. International has competition, and much much lower pricing power. The company is now entering a maturing stage, without a capable MOAT.
Subscribers I don't believe are as sticky as investors who bought back into the story might believe. With rising competition, there is so much more content out there, great content as well and especially with ads too. I can't think of one exciting show coming up in the next 6 months for me. Murder Mystery 2? Love is blind? Lupin and Cobra Kai are OK, but no where near the quality of competition. Whereas I see so much great content on Apple TV+, Hbo Max, even Hulu etc.
I guess you were right on this one. Competition was hiding more losses than it seemed. And becoming online cable of TV vs quality has become a good strategic move. Can't see much disrupting Netflix now even if valuation goes down 50%.