Oil and Gas Industry Notes
"If you really want to understand an industry, look at every company in that industry" - Stan Druck
This document includes notes from a month of studying oil and gas companies. Even if you have no interest in the space, I wanted to share an example of how I go through industries where I have no knowledge. I try to take Stanley Druckenmiller’s simple advice – “if you really want to understand an industry, look at every company in that industry.” So I ended up reading 20+ annual reports and now I have a baseline of knowledge in the space. This is also how knowledge compounds. With that said, here are my somewhat disjointed notes. I know this is a bit different from a normal stock write-up but hopefully it sheds some light on the industry and a part of my studying process. Something I wish I knew about when starting this process was today’s sponsor which helps me zip through earnings calls…
Save hours on earnings calls with instant AI insights. Investing City exclusive: 30% off with coupon: InvestingCity30. Supercharge your equity research now!
The first thing you need to know about oil and gas is that there's upstream (exploration/production), midstream (pipelines), and downstream (refining) and then the integrated companies span all three parts of the value chain (Exxon, Chevron, etc).
Exxon Mobil
So we might as well start with Exxon:
- Founded in 1882. Rockefeller's Standard Oil was started in 1870 and Standard Oil Trust was formed in 1882 so Exxon uses that date. In 1911, an anti-trust case broke it up into 34 separate companies.
Standard Oil of New Jersey later became Exxon and Standard Oil of New York became Mobil. Exxon and Mobil merged in 1999 in a deal worth $81 billion.
Speaking of big deals, Exxon closed on Pioneer Natural Resources in May of 2024 in a $60 billion all-stock deal. Pioneer was an upstream company.
Obviously the price of oil drives the changes in cash flow for energy companies. And just like any other commodity, it's supply/demand driven. I'll leave this debate to the experts but the US supply growth has been astounding because of fracking, especially in the Permian Basin. Demand has been steady but one narrative is that it will drop off because of renewables. Once again, this is beginner stuff.
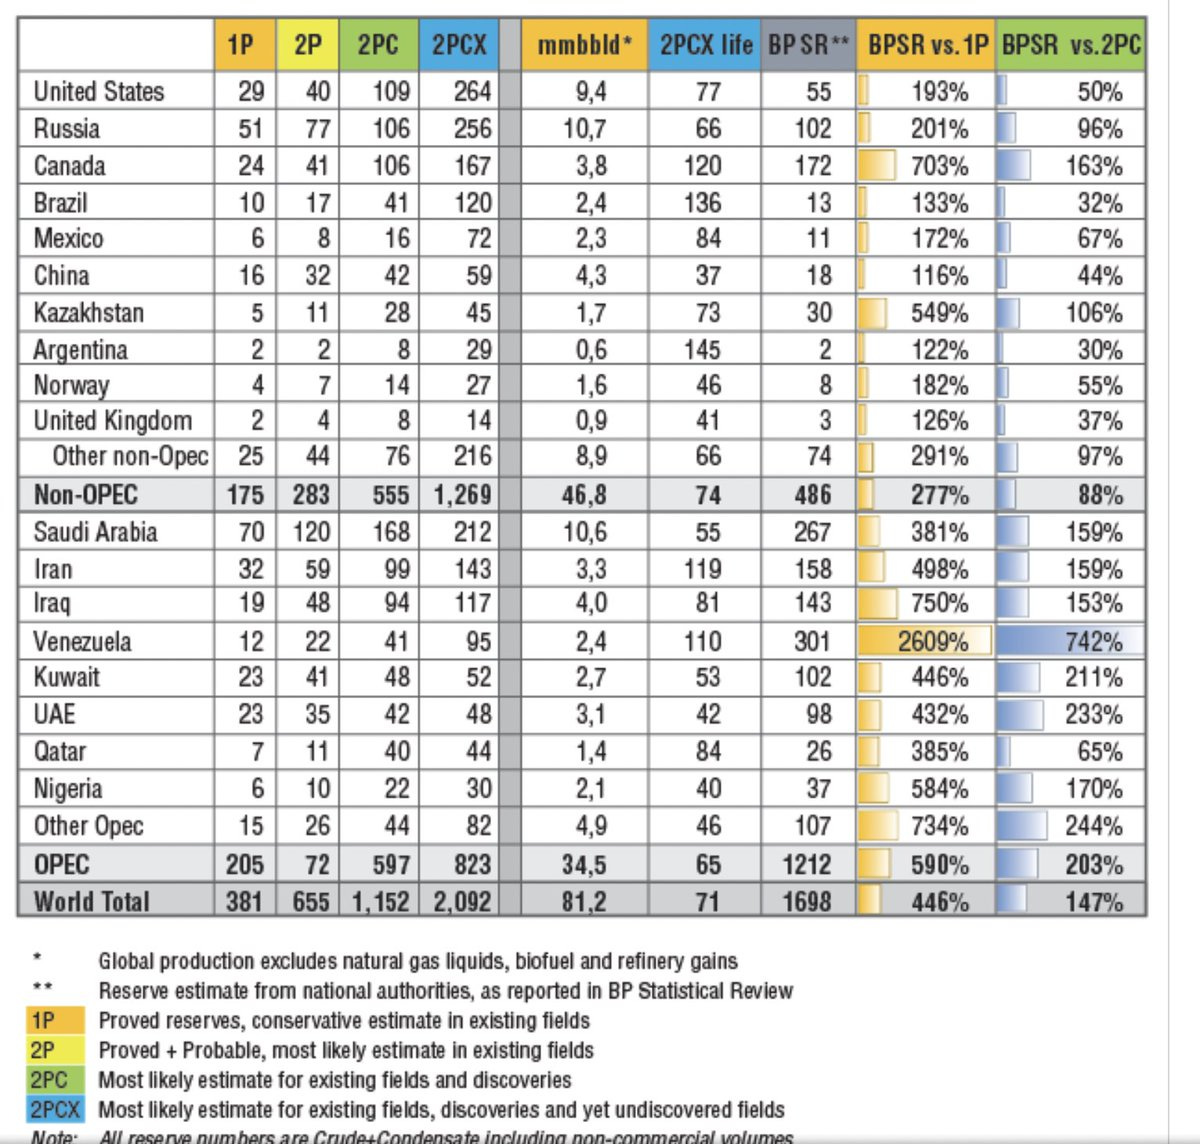
I've seen very different estimates on US oil reserves but this one is bullish with a lot of undiscovered fields factored in.
US proven reserves are much lower than many other countries:
But notice that the US has higher oil production than Saudi Arabia and Iran combined. However, with lower proven reserves (90% confidence interval of recovering oil), the years of production in reserves is considerably lower than other top producing countries. But the US seems to keep discovering new ways to pull dinosaur juice (jk) out of the ground.
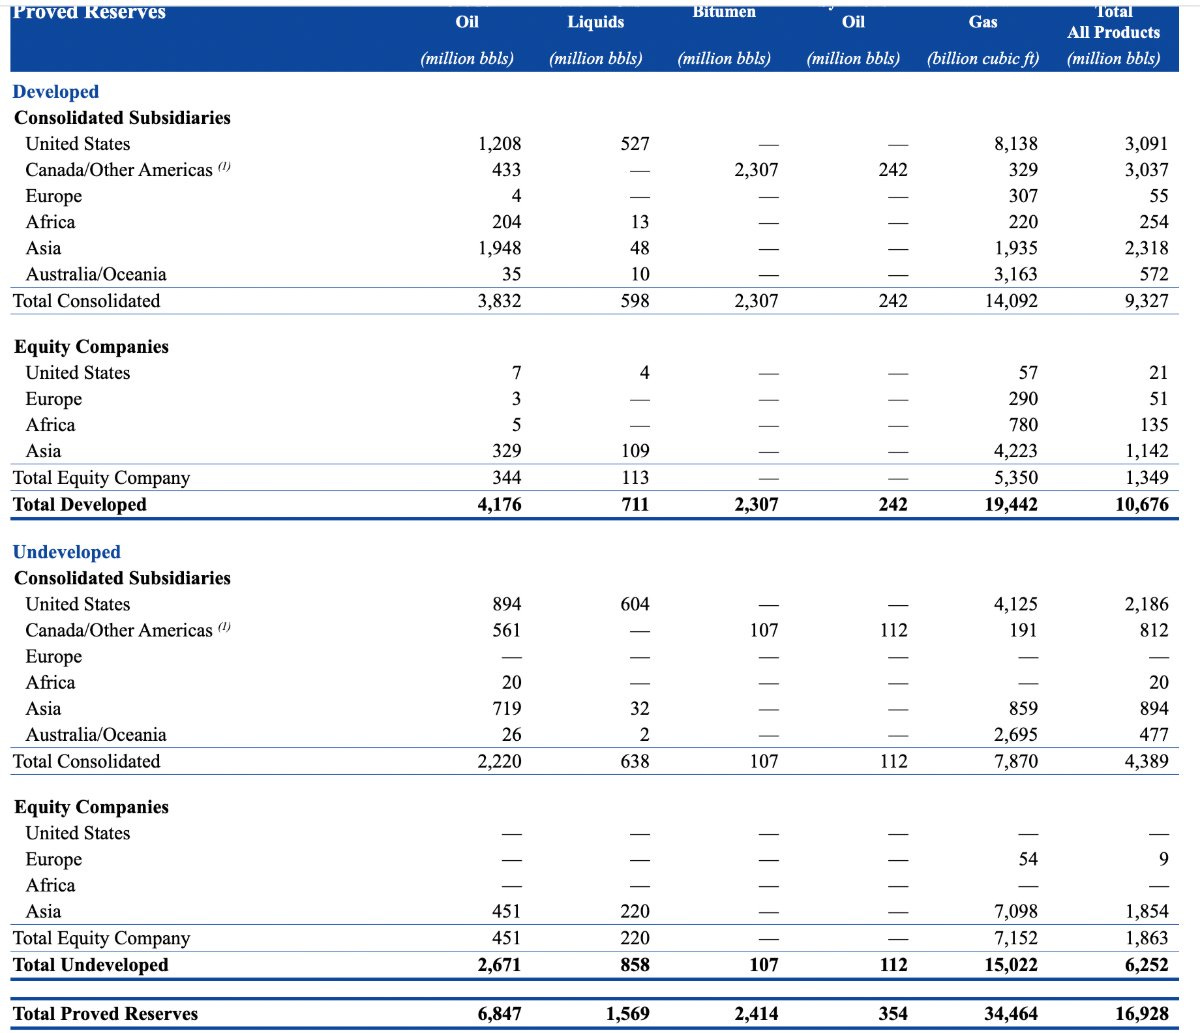
Back to Exxon, here are its proved reserves:
1. ~4.18 billion barrels of oil in developed reserves. These are reserves that already have wells on them. And another ~2.67 billion in undeveloped reserves (these don't have wells on them but there could be building in progress or they are at least 90% sure they will pull up oil).
2. They also have another ~1.57 billion in natural gas liquid reserves (NGL). Natural gas (methane) is pulled out of the ground, usually alongside oil, in a gaseous state. But natural gas is cooled to super low temperatures which allows the heavier hydrocarbons to condense. Then there is a fractionation process to separate the NGLs into propane, butane, and ethane.
NGLs can be sold for more since there is less supply vs. natural gas. Wet gas is when a lot of NGLs can be extracted from the natural gas. Dry gas is when it's mostly just methane.
3. Also 2.4 billion in bitumen reserves. This is super viscous and a large component of asphalt.
4. A few hundred million in synthetic oil. This is highly refined and the oil that could go in your car.
5. ~34.4 trillion cubic feet in natural gas reserves. Natural gas is well, duh, gas. The calculation for a barrel equivalent is 6 billion cubic feet = 1 million barrels. So around 5.7 billion barrel equivalents of natural gas in proven reserves.
For a grand total of 16.9 billion in proven reserves. 6.3 of those were undeveloped so a little over 1/3rd of reserves don't have any wells on them.
As this is the first company we've looked at, we don't know if this is normal or not. This is why looking at tons of companies in the same industry is helpful. You can start making connections. But for now, we need to build that mental database.
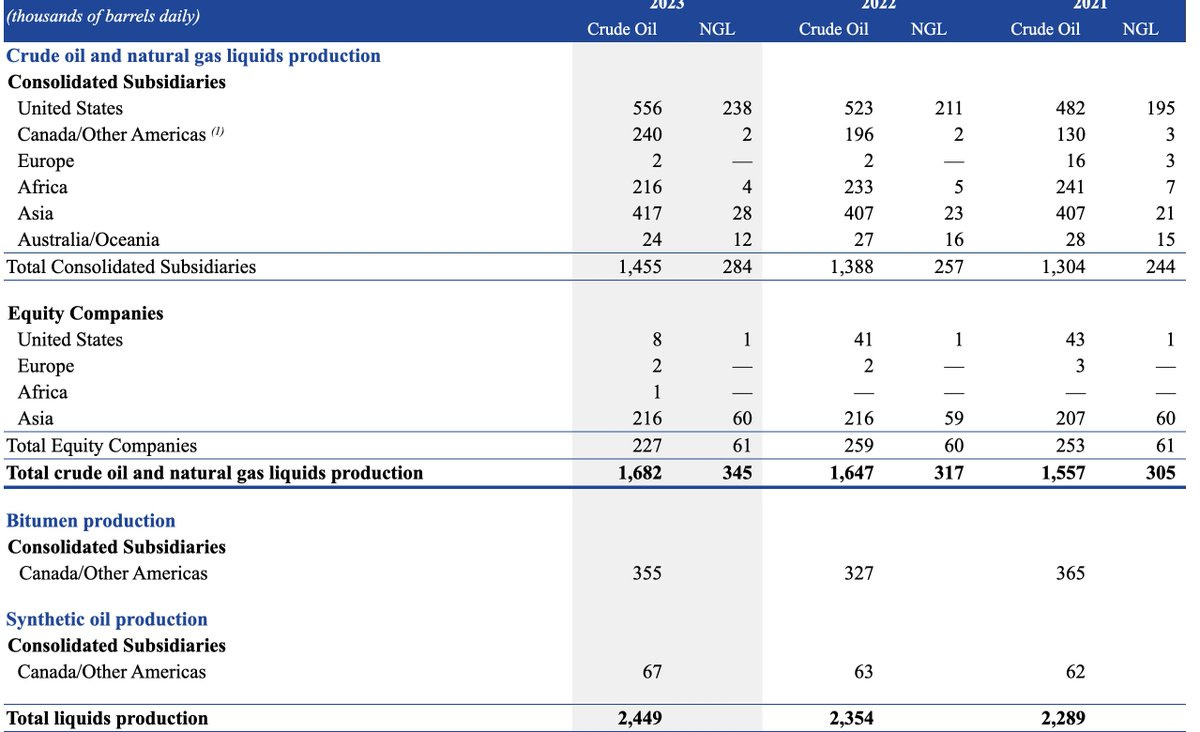
Here are the production numbers for Exxon:
So last year they produced ~1.7 million barrels a day of crude oil and ~2.5 million in liquids, including NGLs, bitumen and synthetics.
And then they produced 7.7 billion cubic feet in natural gas per day. Using the 6 billion to 1 million scale, that is 1.3 million BOE (barrel oil equivalents) for a total of 3.7 million BOEs per day.
So roughly, the company has 16.9 billion in BOE and it produced 3.7 million BOE per day. 3.7 * 360 = 1.3 billion per year. At a constant rate, Exxon would have about 13 years of production left if it never grew proved reserves. Once again, I don't necessarily know if that is a lot or a little at this point.
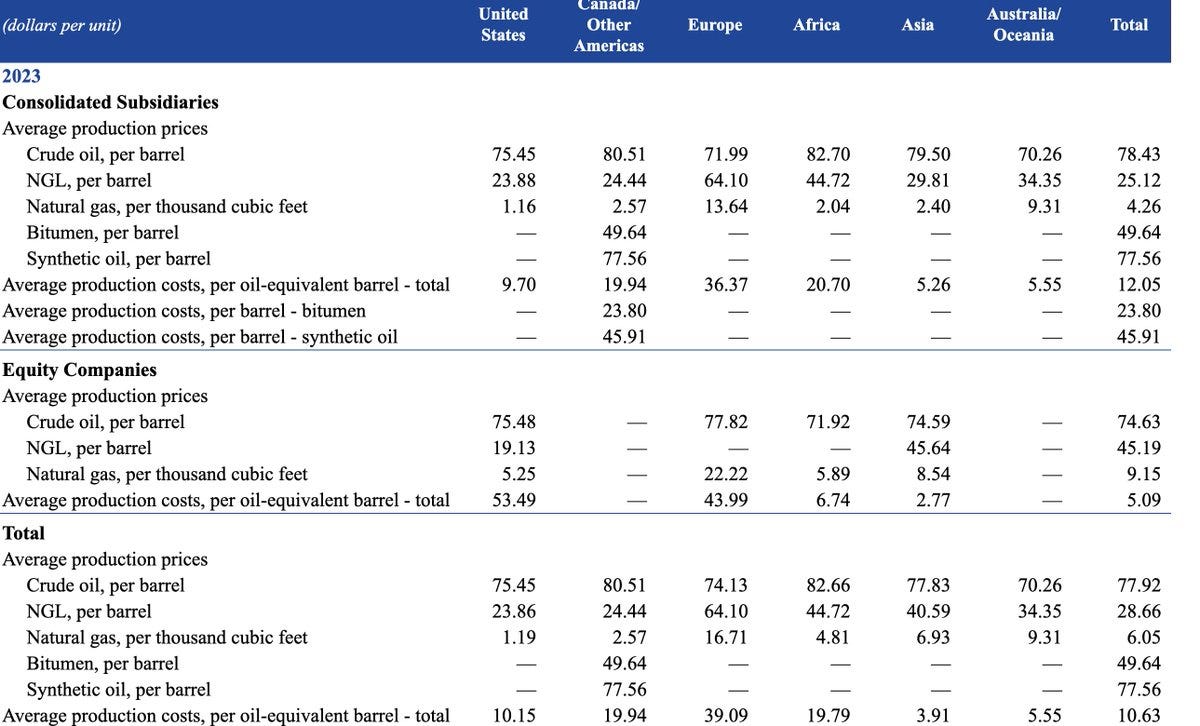
And then these are prices for 2023 across geographies and types of hydrocarbon so you can get revenue by multiplying the average production price & annual production.
Very roughly, the avg. crude oil price was $78 and they produced 1.7 million barrels per day so maybe like $47-48 billion in revenue from upstream crude oil.
Total revenue was $344 billion so maybe like 15% of the total. Seems low but this is just crude oil upstream.
Then the annual report talks about new wells drilled and the amount of land the company owns:
Exxon has 75 million undeveloped gross acres of land and 41 million net so roughly 55% net ownership of all of its acres. It also has 25 million developed gross and 12 million net so slightly lower ownership on the developed.
On the developed acres are 31,000 productive wells and 15,000 net. So roughly 800 acres per well. And they drilled 450 net new wells so maybe 3% growth. And there were 10.7 billion proved reserves OE and 6.3 GOEB (billions of oil equivalent barrels) unproved for a total of 17 GOEB. And the average daily production was 3.7 million. World supply of crude was 103 million per day so XOM has like 4% market share. Aramco did 12 million per day for like 12% market share.
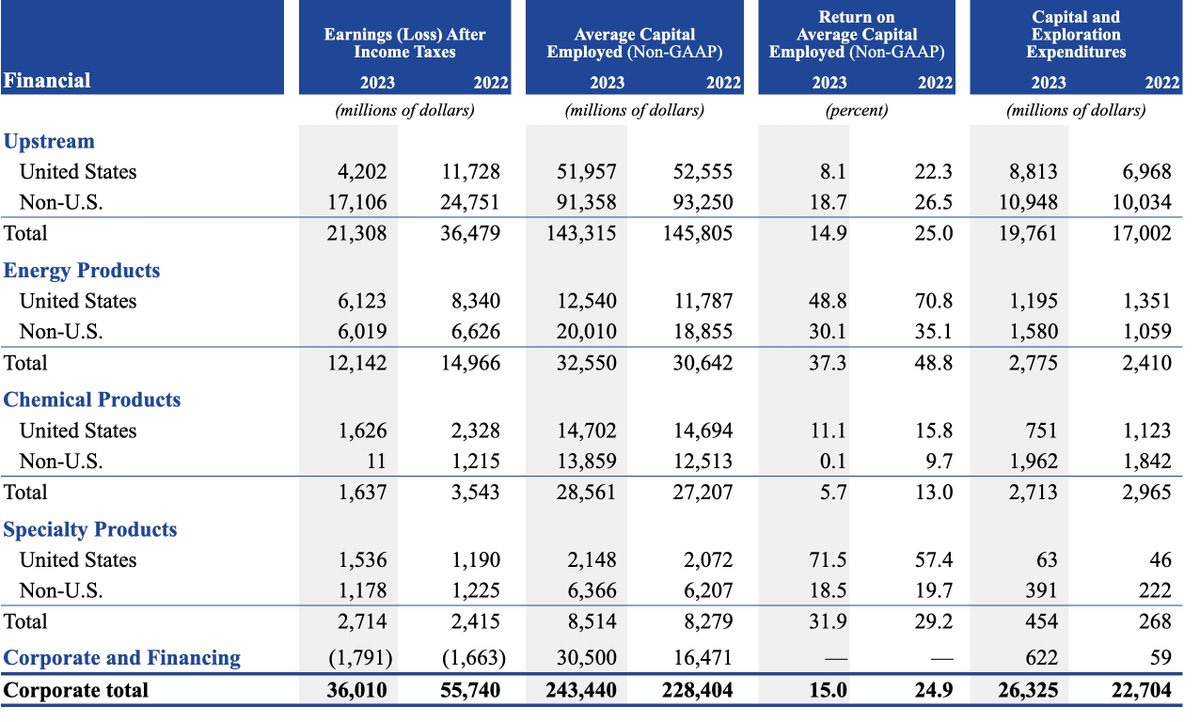
These are the earnings segments:
Upstream is the exploration and production that we've been talking about so far. This can be used internally or sold to other refineries.
Energy Products consist of refining and then selling gas, diesel, aviation fuels, etc.
Chemical Products means the hydrocarbons are turned into rubbers, plastics, etc
Specialty Products are synthetic oils, waxes, lubricants, etc.
You can see from the chart above that the returns on capital employed for refining and specialty products are very high. The vertical integration of the upstream business obviously helps here since they can lower production costs and have more control over the entire process. The upstream business is incredibly capital intensive but it lays the foundation for the other revenue segments. Once again, the profits really depend on the price of oil though which depends on a lot of global factors like China and India's economic activity, OPEC's supply, US drilling activity, etc.
Chevron
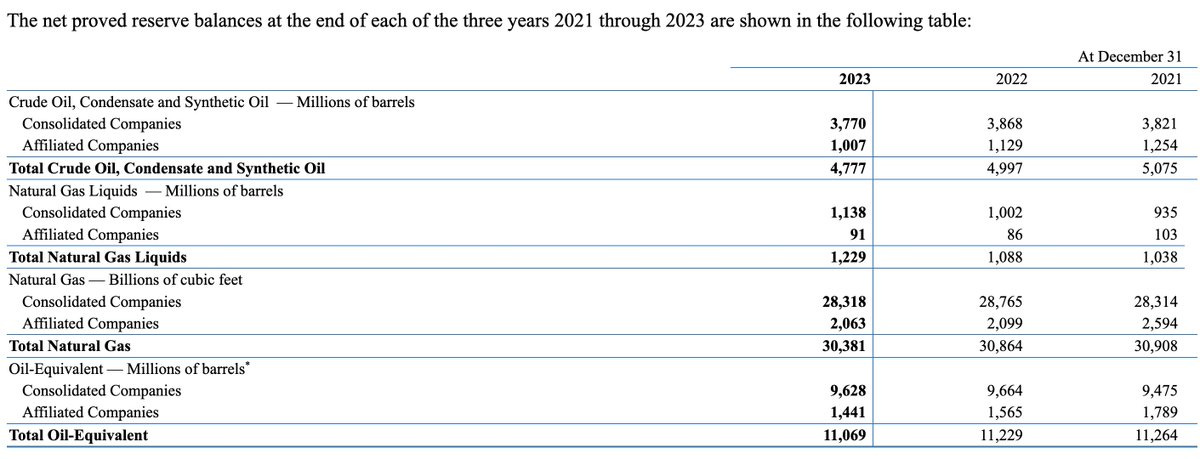
Might as well look at Chevron after Exxon... Net proved reserves at ~11.1 GOEB (billion of oil equivalent barrels). That's 65% of Exxon's. Now we're starting to build the database!
In terms of wells, Chevron actually has many more:
It has ~29k net productive oil wells whereas Exxon has 15k. Exxon has 6.7k gas wells vs. 2.7k for Chevron. This is an interesting strategic difference between Exxon and Chevron. Exxon seems to favor fewer, higher quality wells with an emphasis on offshore projects like Guyana (Exxon has 4.6 million net acres in offshore Guyana). Whereas Chevron has a focus in Permian where horizontal drilling requires more wells. Chevron's upstream capex last year was ~$13.7 billion with 72% of that in the US. Exxon did $19.8 billion in upstream capex with 44% in the US. Exxon did $17 billion in 2022 upstream capex and then produced 3.8 million barrels per day in 2023 so call it $12 of capex per barrel of oil in a year (17,000/(3.8 * 360)). Obviously not a perfect linear process but maybe a helpful metric?
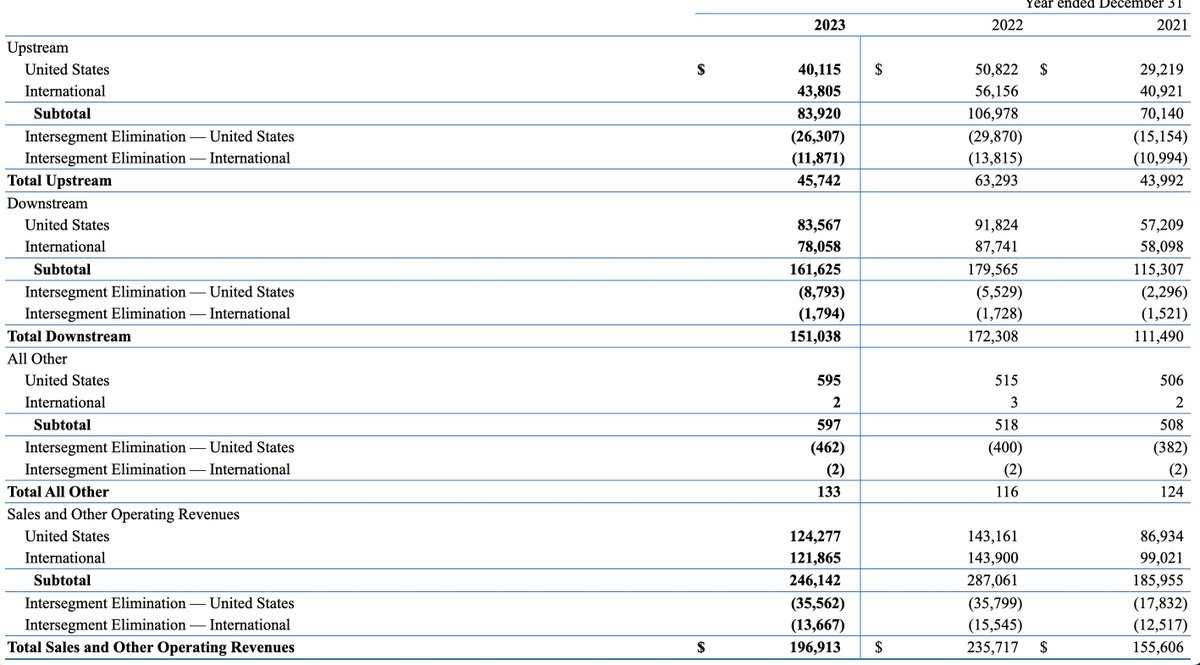
Chevron did $9.6 billion in upstream capex in 2022 and produced 3.1 million barrels per day. So maybe $9 of capex/per barrel/year? I guess this aligns with Chevron targeting more mature fields like the Permian vs. Exxon doing more exploration in international offshore territories. But that also leads to less competition for Exxon and more undeveloped reserves. Trade-offs. Speaking of which, Exxon has 63 million gross developed and undeveloped acres vs. 35 million for Chevron. So Exxon has 80% more land but 50% fewer oil wells and 20% more overall production. These are vastly different strategies. I guess Exxon may face more geopolitical uncertainty but also less competition. If they hit a big reserve like Guyana that can be extremely profitable. However, Chevron's payback periods can be quicker since onshore capex is much lower. Below are some good charts of the revenue segments for Chevron. You can see the intersegment eliminations which prevent double counting. That's why you don't see midstream revenues for the vertically integrated players. According to GAAP they have to sell oil from their upstream operations to the downstream refineries. But when they sell the refined products, that would be double counting revenue so the hydrocarbons that are used internally are eliminated. So for upstream you can see that internal use was somewhere in the ballpark of 45% with a high proportion of US production refined internally rather than sold to external customers.
It's interesting that Exxon's downstream operations (Energy Products) have so many more intersegment charges compared to Chevron ($50 billion on $268 billion revs vs. $10 billion on $161 billion). This could be because of Exxon's big chemical and specialty products businesses. I'm sure this creates more intersegment dynamics if they actually use their own chemicals in their refineries. I'd be curious to learn more about this. Exxon and Chevron could account for the intersegment elims differently too. For example, Exxon only has $25 billion in upstream revenue but $59 billion in upstream elims. That could just mean they use 70% of upstream production internally (59/(59+25)). That makes sense to me.
All in all, it's helpful to compare and contrast companies. We're slowly building the knowledge base. Chevron is more focused on US onshore which can be more capital efficient but also means lower reserves and more competition. Whereas Exxon explores more international, offshore territories which can be riskier but more profitable if it pays off. Further, Exxon uses more of their production for internal purposes and has a more diversified business. Exxon's strategy seems a bit stronger to me from an outside perspective but also it could go through bigger swings if an exploration project fails.
You can read the entire 38 page report using the above link. Thanks for reading!
Our Value-Added Services
Need help with research? — (Dynasty Membership)
Looking to invest in the best companies in the world? — (Infuse Partners)
Want to learn more about investing? — (Free resources)


