If you haven’t heard, we just tore down the pay-wall on Business Breakdowns to make it a free newsletter. As part of the re-launch, we’re rolling out our formerly paid articles over the next several months so sign-up if you’d like to get hit with an avalanche of free business analysis!
Amazon is infamous for "losing money."
But did you know that it has been operating cash flow positive since 2002?
Amazon typically re-invests all of its profits back into the business for growth purposes. When it comes to capital allocation, there really aren’t that many options. Invest back into the business, acquisitions, dividends, or buybacks. Amazon has overwhelmingly chosen the first option.
So while, yes, Amazon doesn't have crazy GAAP accounting profits, it's quite cash generative before capex. In fact, the company brought in almost $47 billion in operating cash flow over the past year while free cash flow after capex and lease repayments was -$20 billion. In effect, they spent $67 billion in capex and leases for fulfillment centers, trucks, servers, etc.
With that out of the way, let's break down how it makes money.
The company has 6 operating segments:
1P (1st-party = Online Store)
3P (3rd-party sellers and FBA)
AWS (Amazon Web Services)
Subscriptions (Prime, Video, Music, etc)
Whole Foods (+ tiny amount from book stores)
Advertising
Below are the segment descriptions, not necessarily in order.
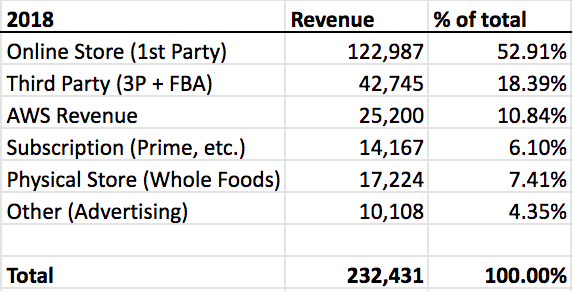
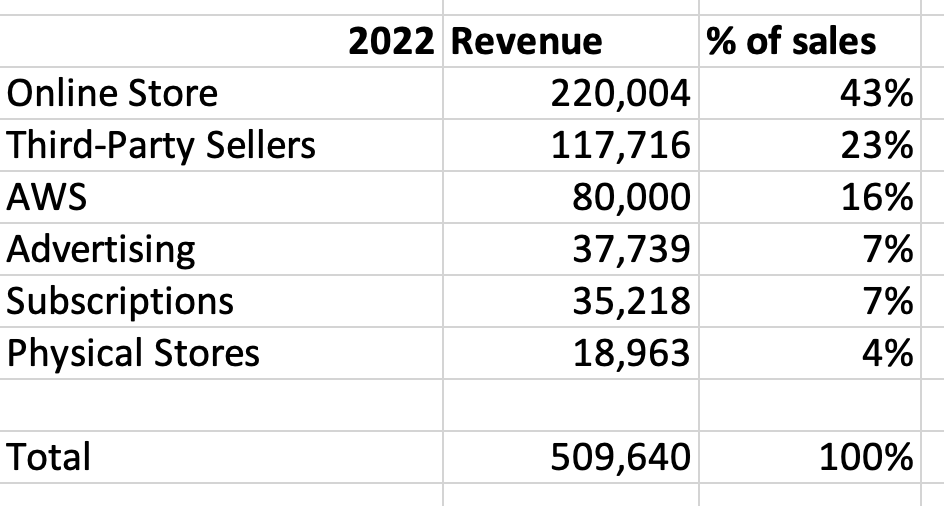
And here are the six segments broken down by revenue in 2018 above and then most recently below.
You can see that the main shifts over the past 5 years are a move to more third-party sellers and then just the overall growth in AWS.
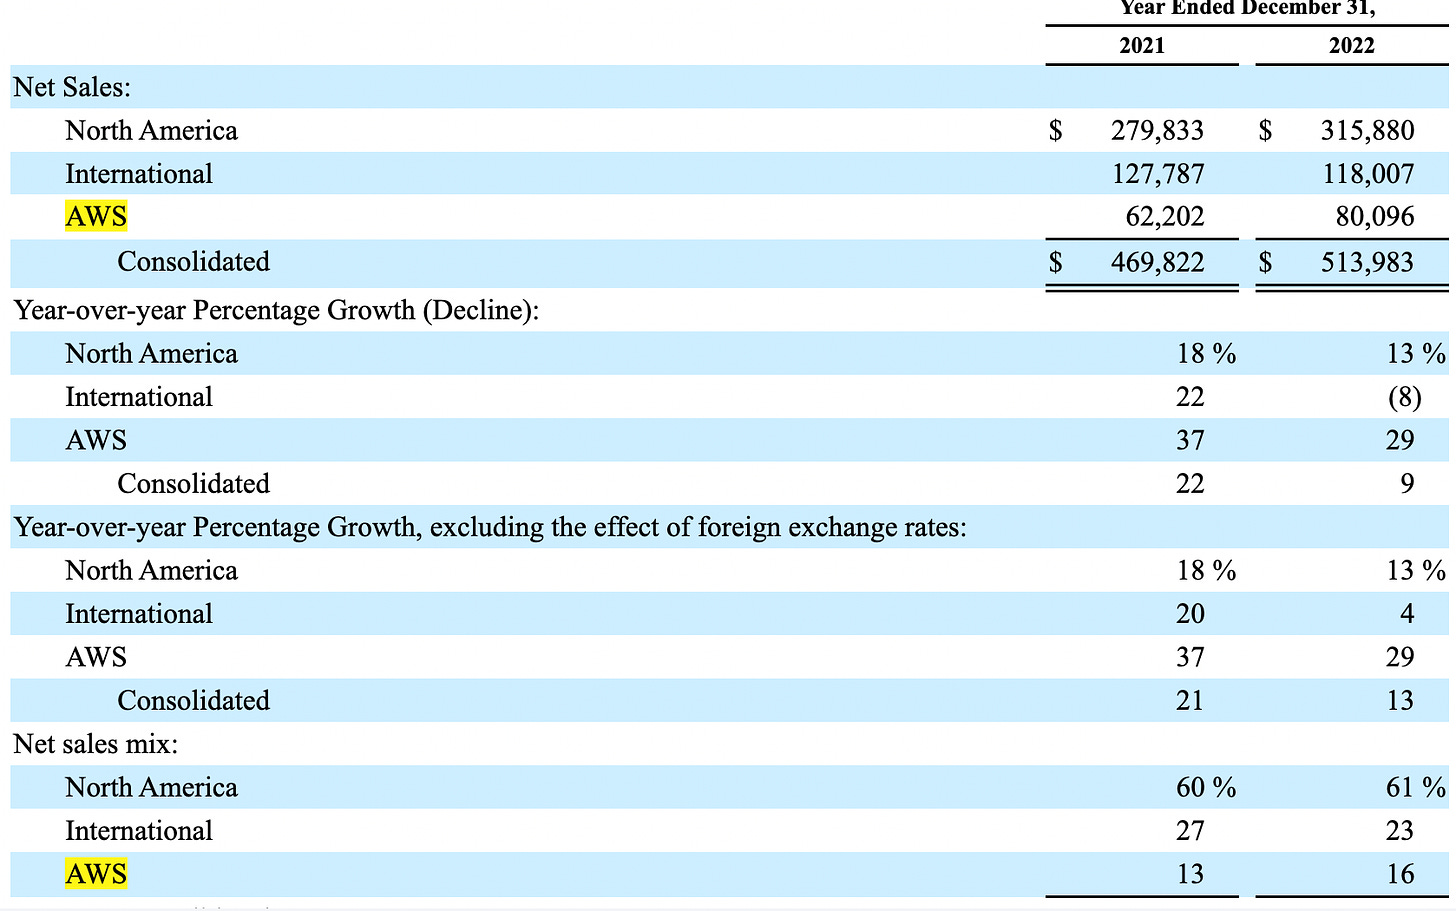
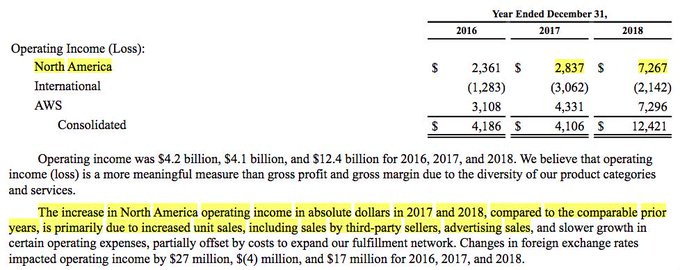
Rather than these six segments, in its 10k, Amazon breaks revenue down into 3 segments:
North America
International
AWS
The big thing to notice here is how profitable AWS is relative to the retail businesses. This is well-known by now but it accounts for all of the company’s EBIT and more.
If you do the quick calculation, AWS has 29% operating margins.
So one way to frame Amazon's business model is that AWS is funding the rest of the business. But that doesn’t take into account capital expenditures. While Amazon doesn’t break out capex by business segment — pretty much no bone does — we can get a sense of capex based on depreciation schedules. For example, fulfillment centers usually have a 40-year straight-line schedule whereas servers are five years, and have recently moved to six.
This is very rough but over the course of Amazon’s life they’ve spent about $280 billion on capex. If that was all fulfillment centers, the annual depreciation would be somewhere in the ballpark of $7 billion (280/40). However, depreciation last year was almost $42 billion. So if all of that PPE was servers, you would expect depreciation to be $56 billion (280/5). This isn’t an exact science though because it’s not that black-and-white. Some networking equipment has a 10-year schedule and not all fulfillment centers are straight-line 40. But the gist is that we can directionally see that servers must make up a decent chunk of PPE. So while EBIT margins are nearly 30%, we can estimate that FCF margins are somewhat lower. At the same time, however, AWS does benefit from a negative working capital cycle since a lot of customers pre-pay for discounts and a lot of depreciation is added back. Only 20% of those original capital outlays for servers are added back though so that’s why I say it’s safe to assume a decent amount lower than 29% FCF margins.
In terms of profitability, there is more to the story and that is the move to being a third-party marketplace.
So a few years back, 58% of Amazon's GMV (gross merchandise volume) of $277 billion was from third-party sellers. This is the last time I saw a proportion officially given out.
In 2021, the latest estimate I’m aware of is $610 billion in total GMV and 3P made up $390 billion of that, or 64%. My guess for 2022 would be somewhere in the ballpark of $700 billion in GMV and $480 billion from 3P providers, seeing that 1P was $220 billion.
So imagine that — there are a few estimates out there — but global e-commerce ex-China is around $2.25 billion. So Amazon accounts for about 1/3rd of all e-commerce, excluding China. The market share is obviously much higher in the US; North America makes up 73% of e-commerce revenue so it’s likely that the most recent market share numbers are over 50% in the US.
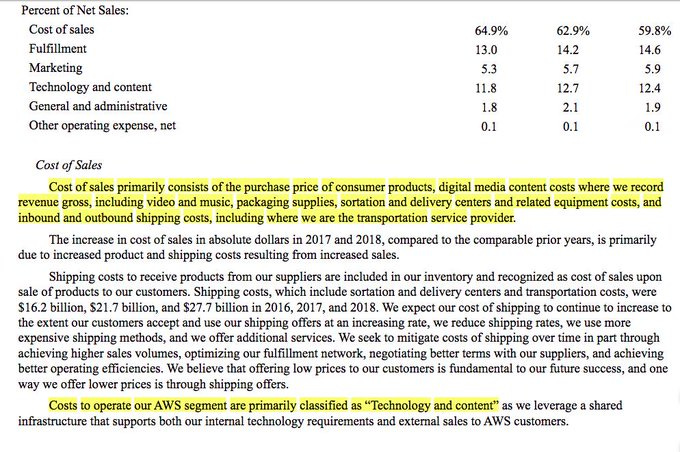
While Amazon doesn't break out profitability between 1P and 3P, it is safe to say 3P is much more profitable. As the shift to 3P has occurred, look at the gross margins excluding AWS.
Further, we can figure out the take-rate based on the GMV (gross merchandise volume) Amazon gave out in 2018 (the first time since 2002 actually)
3P revenue: $42.7 billion
3P GMV: $160 billion
3P take-rate: 26.7%
Here's another clue revealing the importance of third-party sellers.
However, we don’t know exactly how much of that increase in operating income was due to advertising. Amazon’s ad business is now over $37 billion and it’s not far-fetched to say it could’ve done $8-10 billion in EBIT.
Looking back at this Business Breakdown is interesting because it was pre-COVID. You can see that North America was nicely profitable and international was getting somewhat closer to breakeven.
But this, of course, is the most recent P&L.
Classic Amazon, always struggling with GAAP profitability, right? Well, I think it’s missing the point a bit. The company doubled the size of its fulfillment network over COVID and is now making them more efficient. This is how Andy Jassy put it:
And as Brian touched on, it's important to remember that over the last few years, we've -- we took a fulfillment center footprint that we've built over 25 years and doubled it in just a couple of years. And then we, at the same time, built out a transportation network for last mile roughly the size of UPS in a couple of years
Amazon’s moat in logistics is really quite astounding and it’s only getting stronger every day. And as the retail marketplace continues to grow, the cost per delivery shrinks as route density increase. Basically, more orders means more packages on a truck so the incremental cost goes down quite a bit.
Another powerful thing about Amazon is its cash conversion cycle.
It actually can USE the cash it has received from customers as float for 25 days.
This is compared to Costco's 4 day cash conversion cycle. That means it takes Costco way longer, 29 days in fact, for it to go from inventory to cash in the bank. This is because Amazon gets the money from the customer up-front and then pays the suppliers three months later. That’s right, Amazon has continually stretched payment terms. In 2015, they paid suppliers, on average, in 75 days and now they pay them in 90 days.
Amazon is a powerhouse that keeps re-investing in its business. No, it may never focus on GAAP profits. But that’s true to Bezos’ vision of focusing on free cash flow first and foremost. If you look at Amazon’s business without that lens, you won’t understand it. It’s not just a charity, this is what a business with a truly long-term mindset looks like. As Bezos said, “your margin is my opportunity.”






Does Amazon build those 1st-Party product themselves? I don't think so but how does it work then? Do they buy the products, change em a little bit and sell them?
Would be great to update the numbers to the latest (2020), thanks.